There was an interesting Wall Street Journal article this week that took a look at real estate prices vs. average wages and concluded that real estate is still expensive. The author shows a graph of average wages from the US Bureau of Labor Statistics graphed against the S&P Case Schiller 10 City Index. The graph shows that price/wage ratios are still higher today than they were at the peak of the last real estate cycle in 1989.
There are a few problems with this analysis. First, national average wages are being compared to prices in the 10 larges cities, when wages in these cities tend to be significantly higher than the national average. Second, this chart doesn't take into account mortgage rates. Real estate, like any asset can be valued by discounting future expected cash flows. When the discount rate is low a higher price is justified. In 1989 mortgage rates were north of 9% and today they are at half that rate. Third, looking at national numbers obscures what is happening in local markets. A better analysis would calculate the price/wage ratio for each city based on each city's average prices and wages.
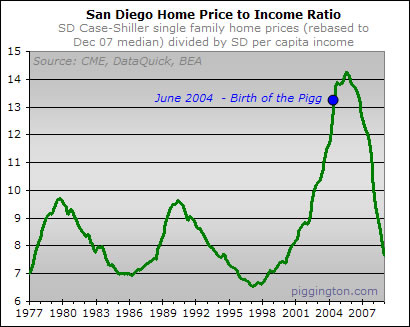
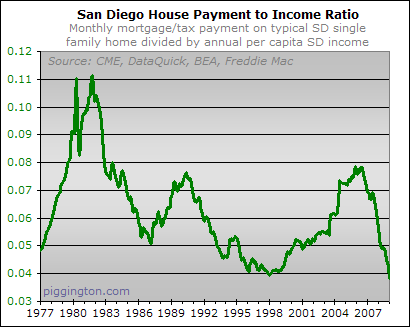
For San Diego, Prof. Piggington's Almanac for the Landed Poor (a great blog that has been tracking the build-up and burst of the local bubble since 2004) has produced just such a graph found here. As you can see, the local price/wage ratio has declined enough that it is back in the middle of the historic price/wage range, without even taking into account the increased affordability due to low mortgage rates. To adjust for mortgage rates you would want to look at a ratio of wages to the fully ammortized mortgage payment required to buy the average house. Prof. Piggington graphed this as well here. As you can see, on a mortgage payment basis, housing in San Diego is more affordable then it has been since at least the 1970s. Now, I wouldn't expect today's low mortgage rates to persist forever, but even if rates came back to the 6-7% range, homes would remain pretty affordable on a historical basis.
Prof. Piggington author Rick Toscano goes on to graph price/rent, mortgage payment/rent and other ratios in the full post and is an excellent read. Each measure shows that the San Diego market as a whole is no longer in bubble territory. It is important to note that Mr. Toscano and piggington.com are not cheerleaders for the real estate market. The blog was created to point out how horribly overpriced real estate was back in 2004 and recounted the bursting bubble somewhat with glee.
As I've said before, real estate markets are fractured. While the average home sold in San Diego has come down to reasonable levels, there are many segments of the market that have only experienced modest declines (La Jolla, Del Mar, etc) where homes are still extremely pricey by any measure. There are other more modest areas (Oceanside, most of East County, etc) that have cratered to the point where prices are incredibly cheap on distressed properties. The problem is that in many of these communities it can be difficult to get a loan, particularly in multi-unit condo and townhome complexes. That is because banks won't extend loans when a certain percentage of units are non-owner occupied, and in many complexes, half the units are bank owned or owned by investors who purchased them after foreclosures. These properties can only be purchased for cash, but for those with the cash you can get quite a bargain with 10% cap rates and price/annual rent ratios below 6.
No comments:
Post a Comment